
HOW BTi HELPS YOU IDENTIFY MARKET OPPORTUNITIES
BTi screens equities, ETFs, commodities, indices, currencies and spreads using different quantitative models to highlight divergences, anomalies and market conditions that may warrant further investigation.
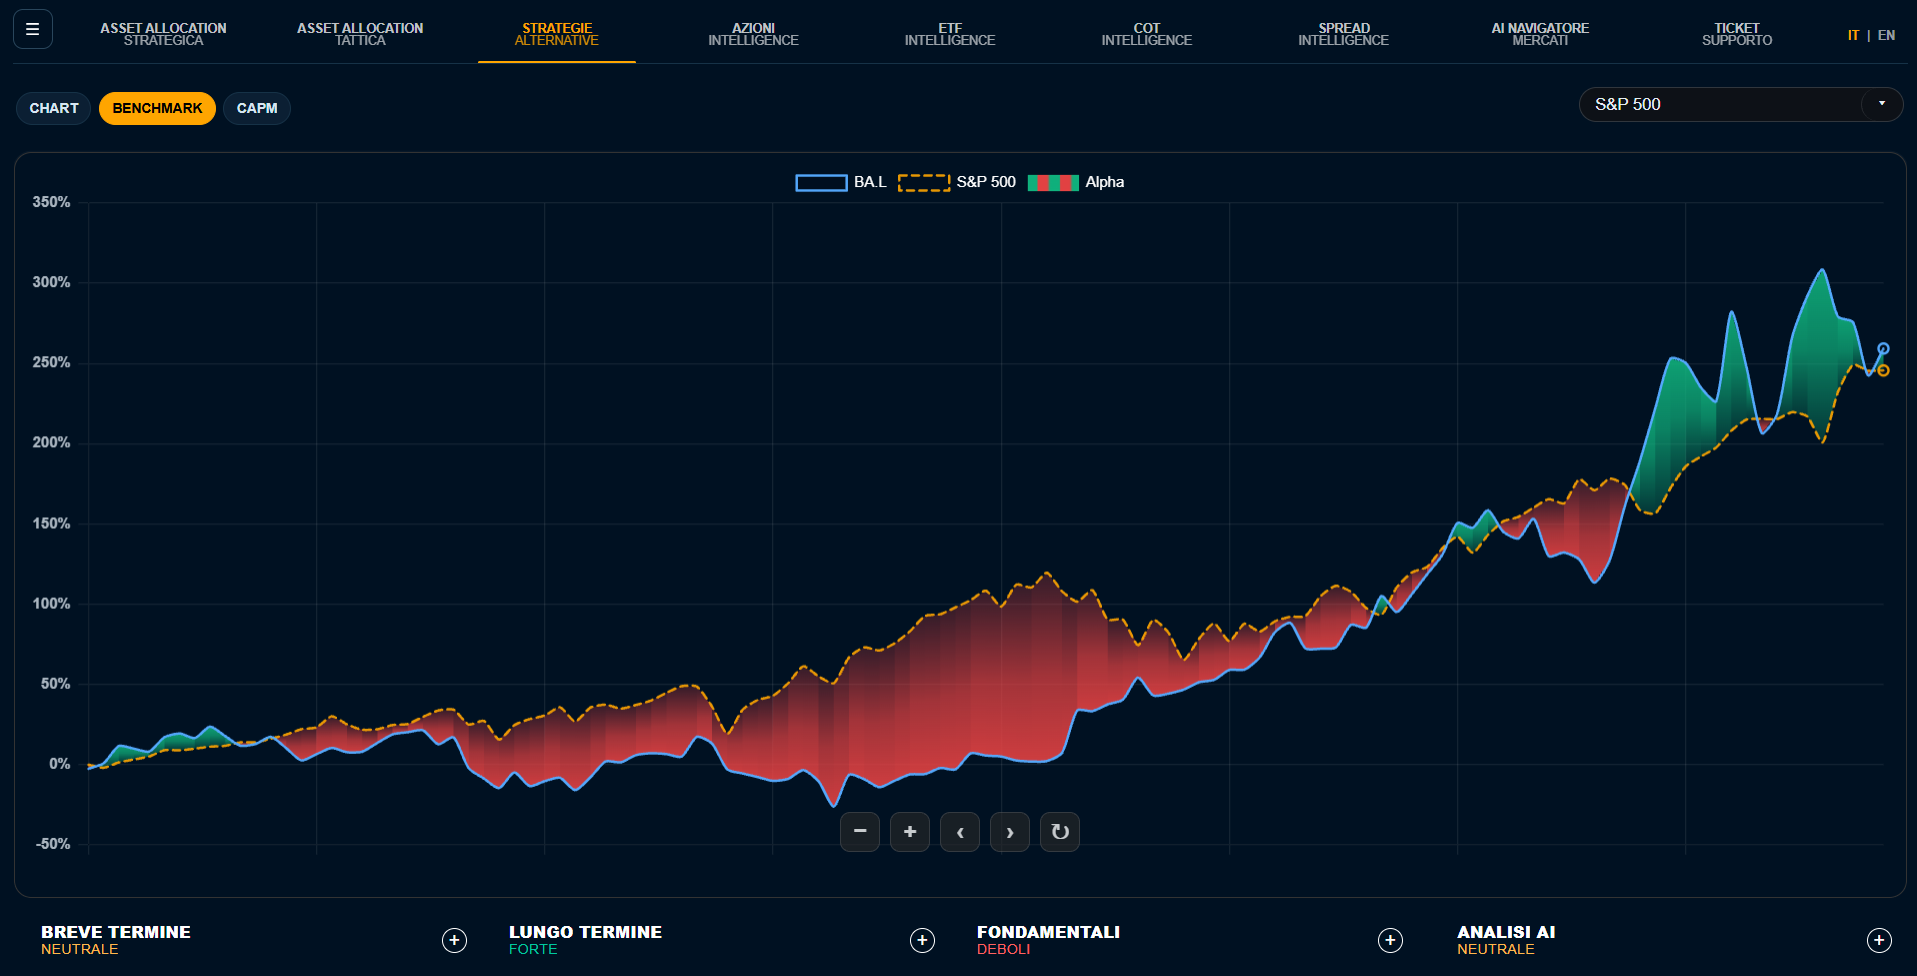
FOUR RESEARCH ENGINES FOR EXAMINING MARKETS FROM DIFFERENT PERSPECTIVES
Each area applies its own criteria to turn thousands of instruments into a more manageable selection of situations worth analysing, comparing and investigating further.
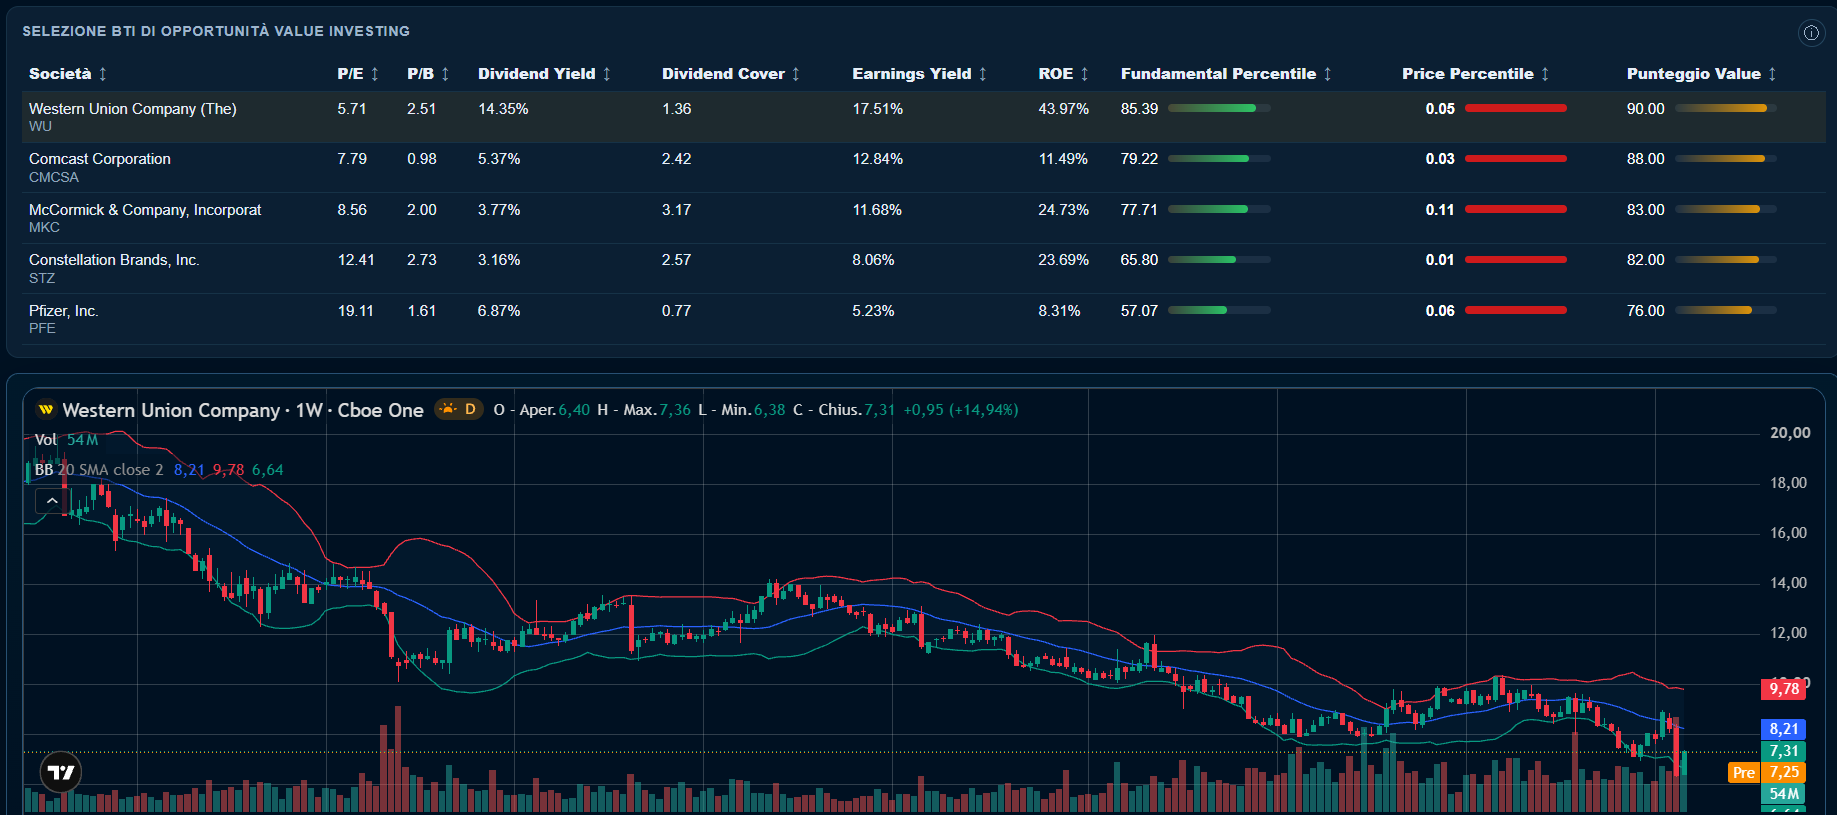
SCREEN THE EQUITY MARKET FROM COMPLEMENTARY PERSPECTIVES
BTi analyses thousands of stocks to highlight situations where a company's quality, growth or relative strength may not be fully reflected in its current share price. Each model follows a different approach, allowing users to assess the market through fundamental, quantitative and momentum criteria.
VALUE INVESTING
Screen for companies with sound value fundamentals and relatively modest valuations, highlighting potential differences between underlying business quality and market prices.
GROWTH INVESTING
Identify companies with robust growth fundamentals and valuations that remain reasonable, following a Growth at a Reasonable Price approach.
QUANTITATIVE INVESTING
Select stocks with above-average quantitative risk/return profiles that are experiencing short-term price weakness.
MOMENTUM INVESTING
Screen for stocks showing stronger relative strength and resilience than the market while undergoing very short-term pullbacks.
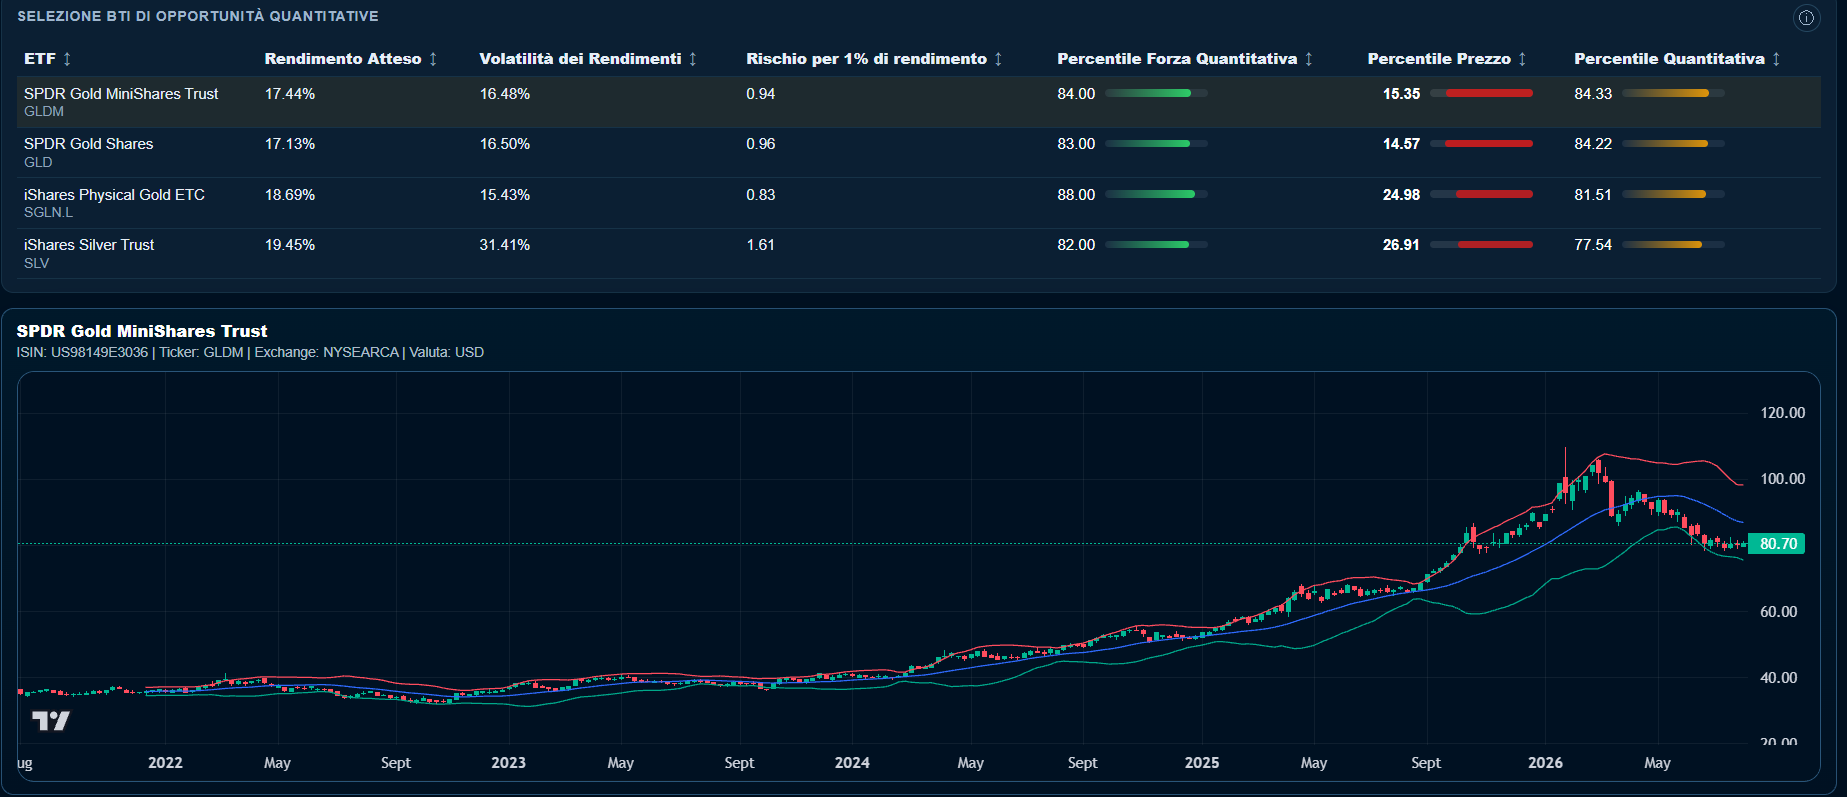
IDENTIFY INTERESTING CONDITIONS ACROSS MARKETS, REGIONS AND SECTORS
BTi applies quantitative and momentum models to equity, regional and sector ETFs, helping users compare exposures under consistent criteria. The platform highlights instruments combining favourable quantitative characteristics with temporary weakness or stronger relative performance than the broader market.
QUANTITATIVE INVESTING
Highlight ETFs with above-average quantitative risk/return characteristics that are experiencing temporary price weakness.
MOMENTUM INVESTING
Identify ETFs showing stronger relative performance than the market or comparable instruments alongside a short-term pullback.
PULLBACKS WITHIN A LONG-TERM UPTREND
Identify ETFs tracking equity markets with established structural uptrends that have recently fallen below predetermined quantitative levels, highlighting short-term weakness within an otherwise positive longer-term environment.
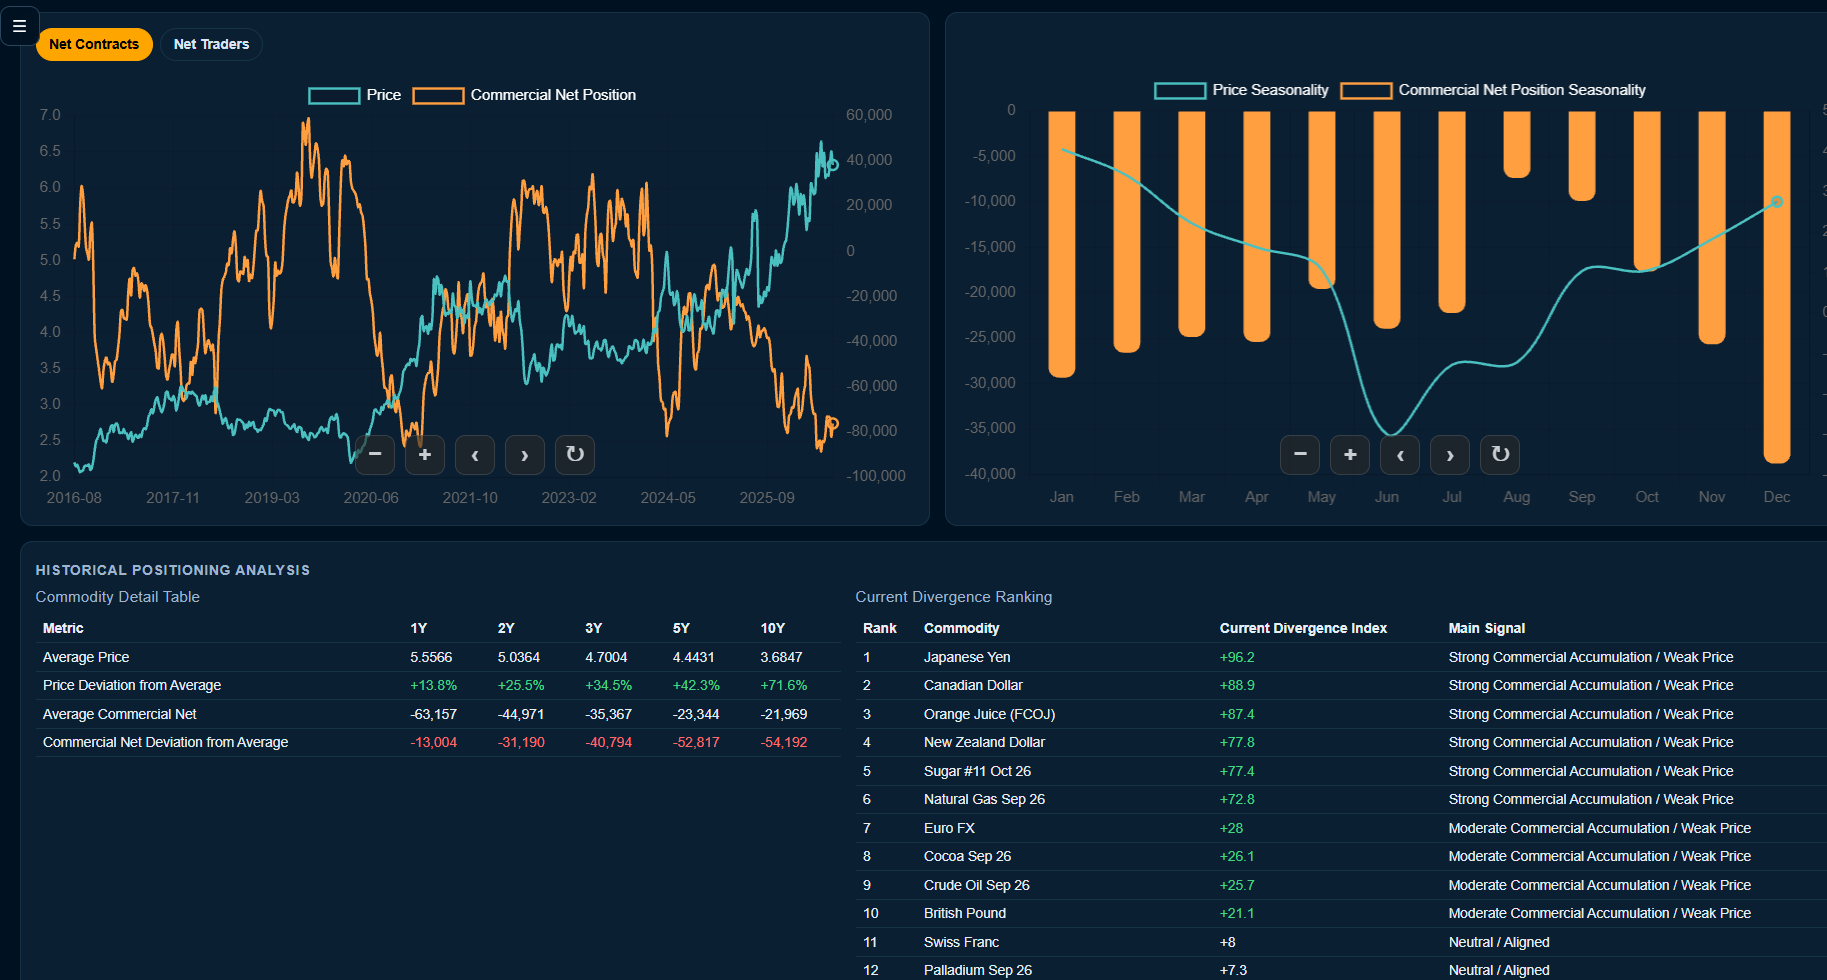
COMPARE PRICE MOVEMENTS WITH COMMERCIAL TRADER POSITIONING
BTi uses Commitment of Traders reports to analyse the positioning of commercial market participants and compare it with price trends. The platform looks for situations where a commodity, equity index or currency behaves significantly differently from the actions of companies and professionals directly active in the underlying market.
These divergences can highlight situations worth investigating. For example, a commodity may be trading at unusually low prices while businesses directly involved in that market are significantly increasing their exposure. BTi organises this data and makes it easier to interpret, without automatically turning it into buy or sell signals.
ANALYSE STATISTICAL DIVERGENCES BETWEEN RELATED INSTRUMENTS
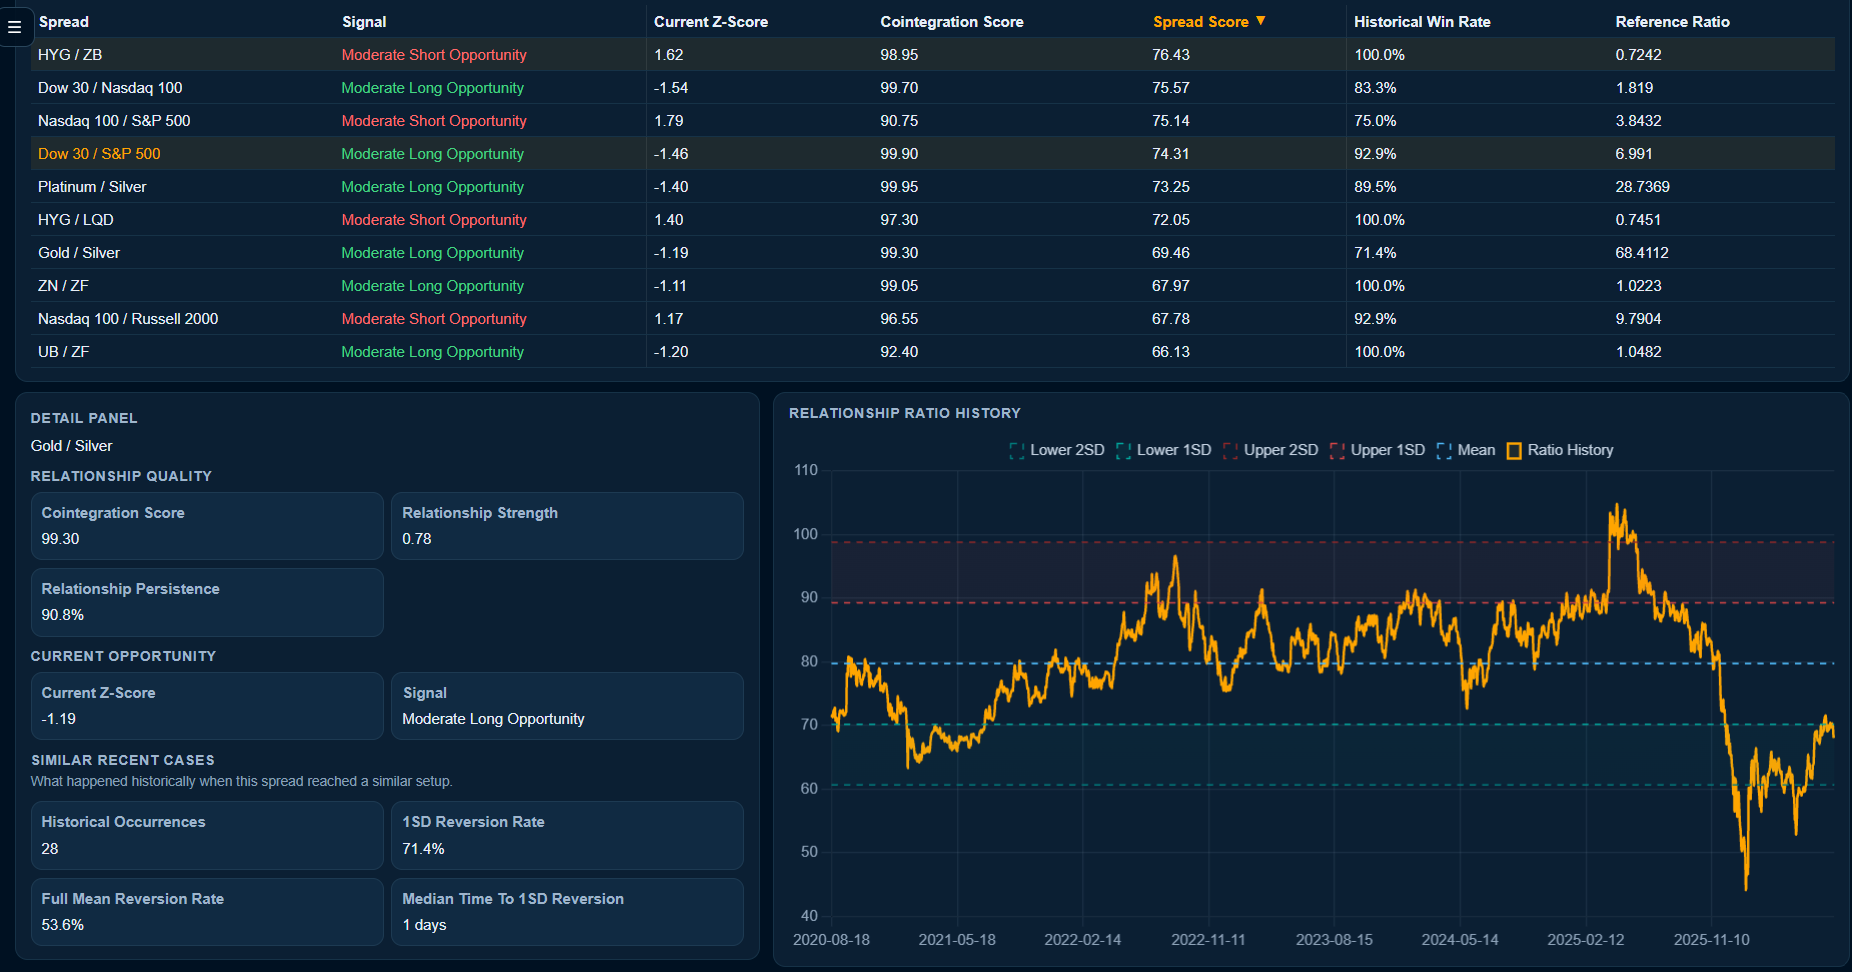
BTi screens synthetic pairs of equities or futures for instruments with historically stable statistical relationships. The system assesses cointegration, the persistence of the relationship over time and the size of the current deviation relative to its usual range.
BTi therefore highlights spreads whose current divergence is substantially wider than the pair's historical behaviour. The approach is based on the relative relationship between connected instruments rather than the market's overall direction, providing a market-neutral perspective for research and analysis.
EXPLORE MARKETS THROUGH A MORE STRUCTURED RESEARCH PROCESS
BTi provides market intelligence tools designed to analyse thousands of instruments, compare different signals and highlight situations that may warrant further investigation.